Back to projects
Sales Performance Dashboard
Abstract.From raw sales data to interactive KPIs and trends that support business decisions.
- Role
- Developer
- Period
- May to Jun 2024
- Context
- Personal project
- Team
- Solo
| DAX | KPI measures with category, region and customer drill-downs |
01How it works
- Input Connect data Combine several sales datasets into one model.
- Step 02 Clean (Power Query) Cleanse and transform the data for analysis.
- Step 03 Model & DAX KPIs Revenue, quantity and repeat rate defined in DAX.
- Step 04 Visualize Interactive views by category, region and customer.
- Output Insights Surface the trends that drive decisions.
02What I built
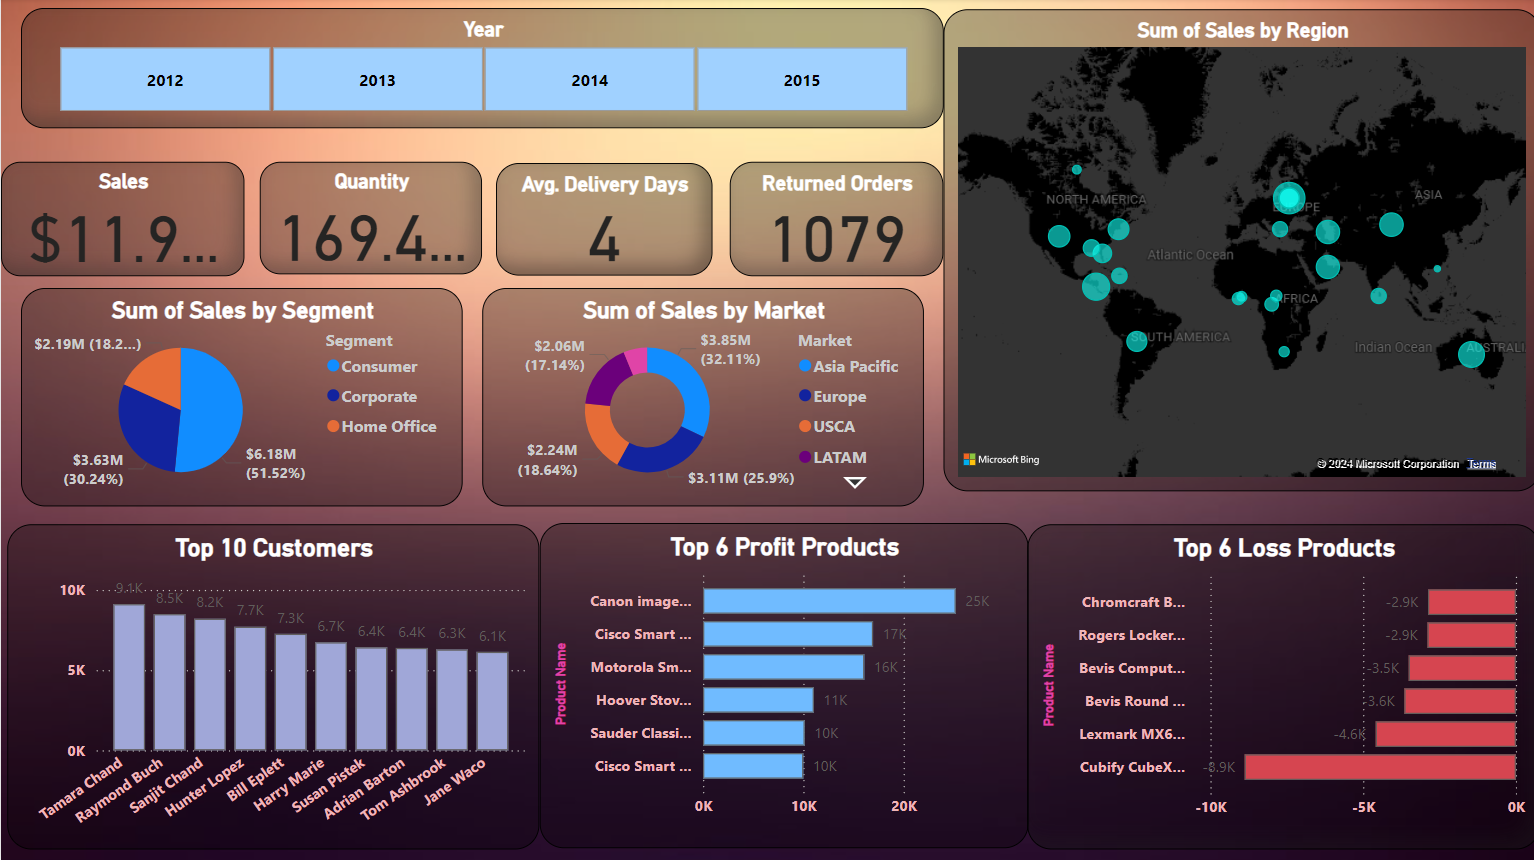
- Integrated multiple sales datasets into one data model in Power BI Desktop.
- Cleaned and transformed the data with Power Query.
- Defined KPIs (revenue, quantity, average price and repeat rate) with DAX, and analysed trends by category, region and customer.
03Technologies
- Power BI
- Power Query
- DAX
- SQL Server